Generative Video Intelligence
The World,
Live
In Your Pocket.
"News the way it should be — personalised, visual, and live."
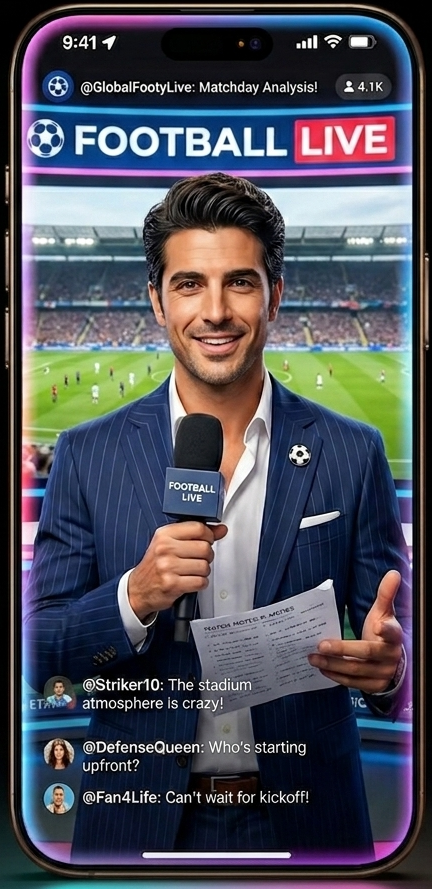
LIVE NOW
"News the way it should be — personalised, visual, and live."
wasted daily hunting news across fragmented apps
of digital video revenue is mobile — yet news stays text-first
adaptive reel feed to replace all of them
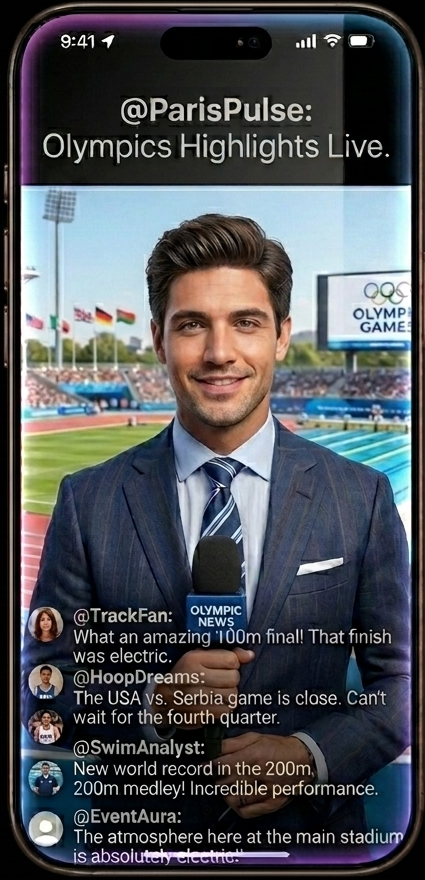
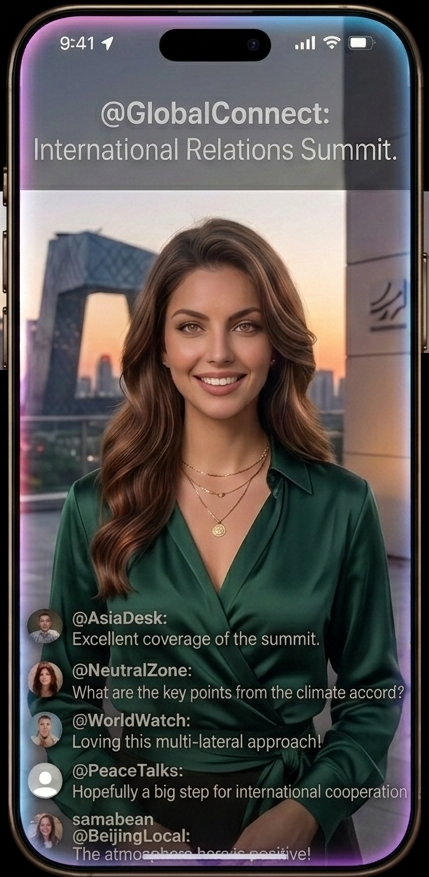
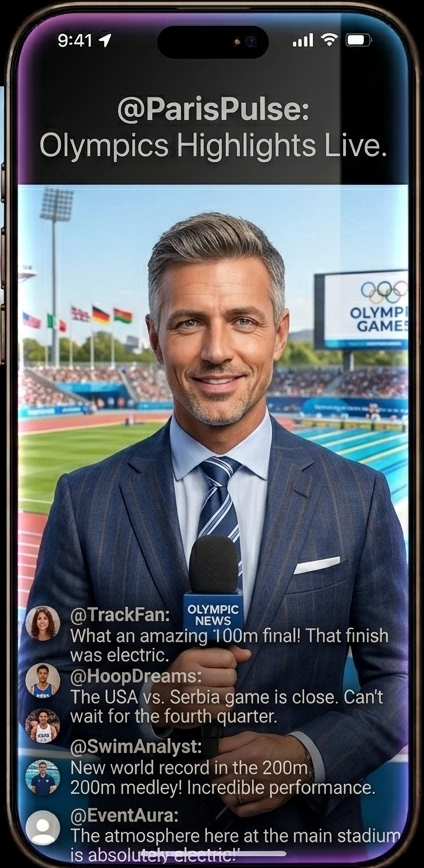
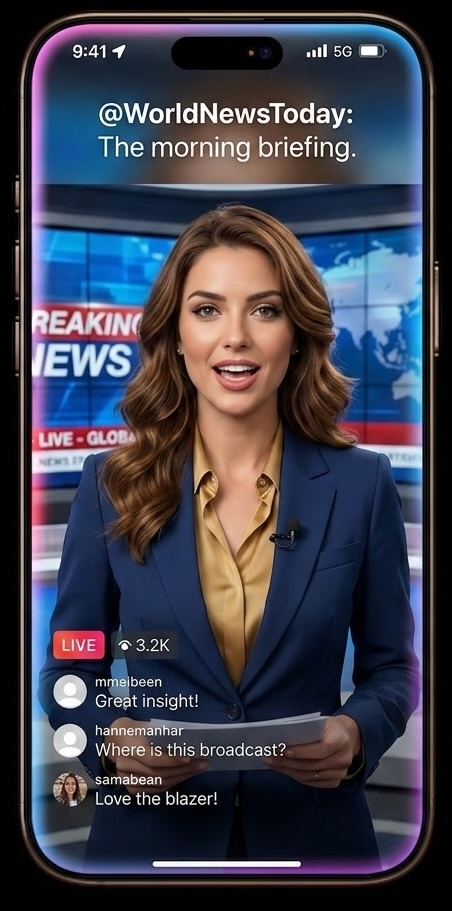
Multiple AI anchors — each with a distinct voice, personality, and area of expertise. Choose yours, or let AIOVEL personalise it for you.
What TikTok did for entertainment,
AIOVEL does for intelligence.
Perplexity depth. Short-form format. Real-time.
Rolling out to our waitlist in summer 2026. Join now.
No spam. Unsubscribe anytime.