Presidential Election Cycle Theory 🦅 How Politics Impact Stock Prices 📈🇺🇸
Strategy
April 2024
The United States boasts a well-established four-year presidential election cycle believed to wield influence over stock market performance. As we anticipate the 2025 inauguration, investors are closely monitoring the upcoming elections. Let's delve deeper into the presidential cycle theory and explore historical data to discern how markets typically fare in each election year.
What is the Presidential Election Cycle Theory? 🤔
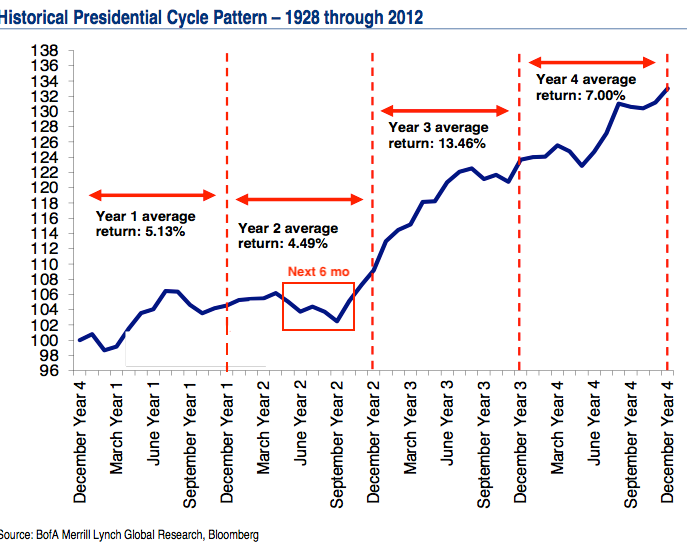
The theory posits that stock markets follow a discernible pattern tied to the year of a president's term. It suggests that the first year experiences weaker performance, with gains progressively increasing in subsequent years. This implies a potentially challenging 2023 market, followed by stronger years in 2024-2026.
Evidence for the Theory 📊
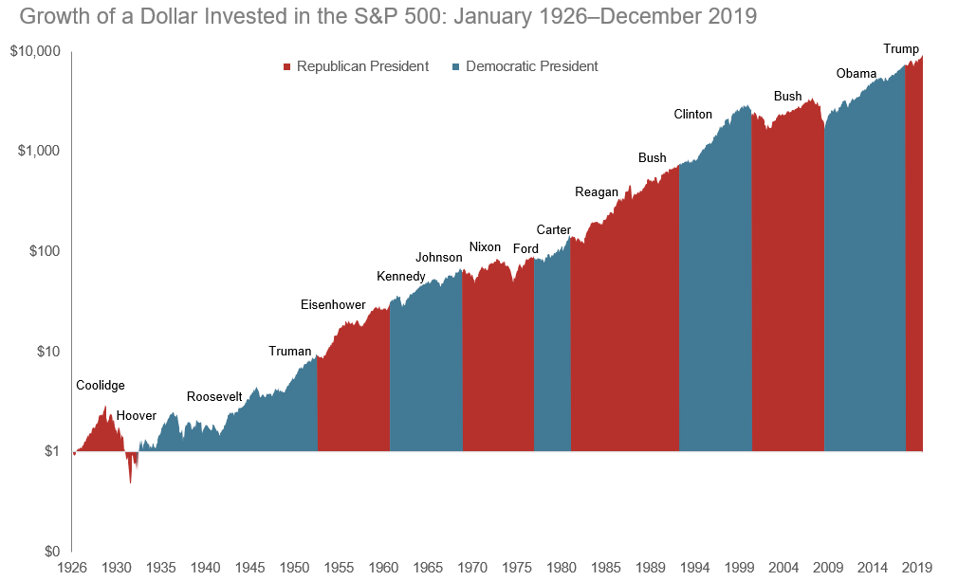
Looking back, some first years, such as 1969, 1977, and 1981, did witness the S&P 500 decline under new presidents Nixon, Carter, and Reagan. However, recent years have seen deviations – 2009 and 1993 posted strong gains in Obama and Clinton's first years. Since 1944, the average first-year return remains positive at 6.2%.
The presidential election cycle theory suggests the first year under a new president will see weaker stock market performance. However, David Settle of Investools notes this hasn't held true in recent decades.
For example, in 2009 under President Obama and 1993 under President Clinton, the S&P 500 saw massive gains of 23.45% and nearly 10% respectively - during what was supposed to be a down year. Stocks also rose in 1989 in President Bush's first term.
Looking more closely at historical data, on average from 1944-present, the market has gained 6.2% in the initial year of a new presidency. While below the overall 8.6% annual return, it's still firmly in positive territory.
In fact, S&P Global Intelligence finds this 6.2% return makes the first year one of the better performing periods within the four-year cycle.
All this calls into question if the presidential cycle theory truly predicts market behavior. While it provided insights in the past, the deviations in recent history suggest other factors may now dominate short-term market moves more than political cycles alone. Investors thus can't rely too heavily on any one theory to time the market.
A Better Indicator: The Third Year Bump 📈
The presidential election cycle theory has long suggested stocks perform better in the later years of a president's term. But which year really sees the strongest returns?
In 2016, researcher Lee Bohl dug into historical S&P 500 data from 1933 to 2015. What he found was intriguing - while the first two years didn't show big gains as predicted, the third year stood out.
Specifically, the third year of a presidency saw average returns of 16.3% for the S&P 500 over that time period. That's well above the 6.34% long-term average annual return! Other years saw more modest 6-7% on average.
Breaking it down further, Bohl found:
Year 1 returns: +6.7%
Year 2 returns: +5.8%
Year 3 returns: +16.3%
Year 4 returns: +6.7%
So while the theory said the market slumps early, the real bump seems to come in the third year - and it's a big one historically. With returns over 80% of the time, investors would have done well betting on the elusive "third year bump".
Summary 📝
In conclusion, while politics undeniably influence investor sentiment, data suggests that stock performance is more closely linked to the four-year presidential cycle. Election years, averaging a 5.89% Dow Jones return over 121 years, showcase a distinct pattern. Pre-election years fare even better at 9.03%, while post-election and midterm years exhibit weaker performance.
Though presidential cycles provide a framework, other factors such as economic conditions, corporate earnings, and international events also shape short-term market swings. In navigating these dynamics, staying informed about all influences and maintaining a disciplined long-term strategy remains key for investors. 🌐💼
📮FAQ
Some Frequently Asked Questions.


See other articles
Slots are the most popular game in casinos worldwide, both offline and online. With over 1,000 slot games to choose from at top online casinos, it's easy to see why. While slot games come in endless themes, most follow the same core mechanics. In this guide, we'll show you how to play online slots and provide some tips to help maximize your chances of winning big.
A Comprehensive Guide to the Buy and Hold Strategy, Complete with Two Winning Examples and Top Stock Picks 💡
In a recent appearance in London, billionaire Ken Griffin, the CEO of Citadel, the world's most profitable hedge fund, shared some invaluable career advice that transcends age and experience levels. With a track record of success that has seen Citadel's gains soar to an astounding $65.9 billion since its inception in 1990, Griffin's insights carry significant weight. In this blog post, we'll delve into his top career advice and explore how you can apply it to your own professional journey. 💼💡


